
Analyzing food pie chart percentages represents one of the most common tasks you will encounter in IELTS Writing Task 1. These charts typically display nutritional data, meal compositions, or dietary patterns using visual representations that require careful interpretation and academic description. Mastering the analysis of food pie chart percentages demands with ieltssamplebanks.com, understanding how to identify key patterns, make meaningful comparisons, and present data using sophisticated vocabulary while maintaining clarity and precision throughout your response.
IELTS Writing Task 1 Question – Food Pie Chart Percentages Analysis
The charts below show the average percentages in typical meals of three types of nutrients, all of which may be unhealthy if eaten too much. Summarise the information by selecting and reporting the main features, and make comparisons where relevant.
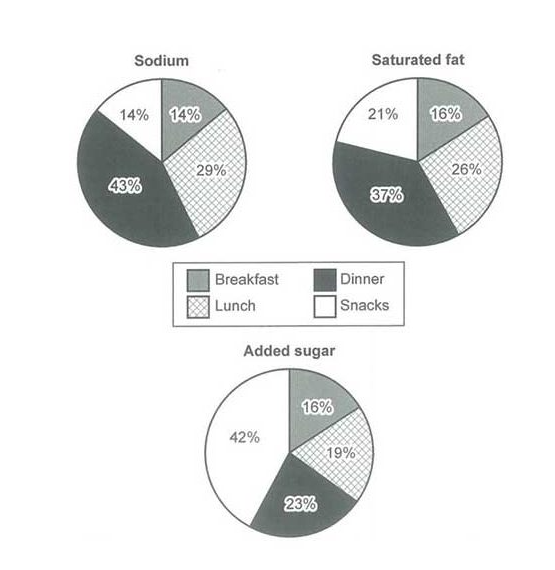
This task requires you to examine three pie charts displaying nutritional content across different meals throughout the day. You must analyze the distribution of sodium, saturated fat, and added sugar across breakfast, lunch, and dinner, identifying which nutrients predominate in each meal and noting significant variations between meal types.
Your analysis should demonstrate clear understanding of the data while highlighting the most striking patterns and differences. Focus on the proportional relationships between nutrients and meals, ensuring you support your observations with specific percentage figures from the food pie chart percentages provided in the visual data.
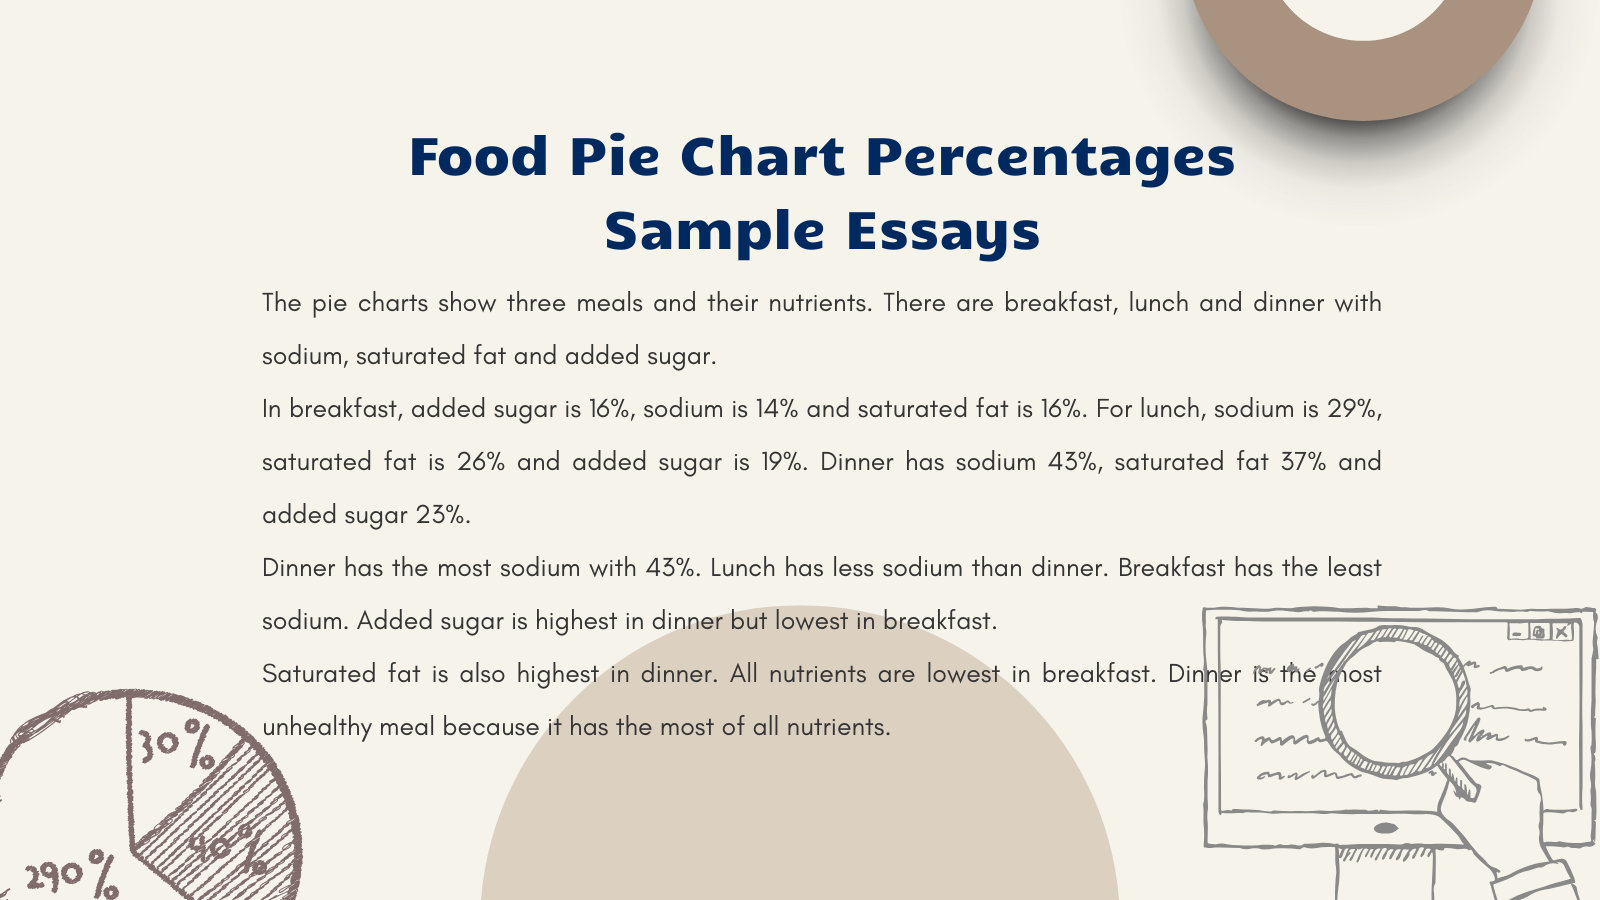
Food Pie Chart Percentages Sample Essays: Three Levels of Achievement
The IELTS Writing Task 1 pie charts below display the proportion of three nutrients—sodium, saturated fat, and added sugar—commonly found in breakfast, lunch, and dinner. These nutrients are typically associated with health risks when consumed in excess. Below are two sample Band 7+ responses that demonstrate how to describe, group, and analyze this type of nutritional data clearly and effectively.
Model Answer 1
The three pie charts illustrate the proportional distribution of three potentially harmful nutrients – sodium, saturated fat, and added sugar – across typical breakfast, lunch, and dinner meals.
Overall, dinner contains the highest concentrations of all three nutrients, while breakfast shows the lowest levels. Sodium demonstrates the most dramatic variation between meals, ranging from 14% at breakfast to 43% at dinner.
Examining each meal individually, breakfast maintains relatively balanced nutrient levels with sodium at 14%, saturated fat at 16%, and added sugar also at 16%. Lunch shows increased nutrient concentrations, particularly sodium which rises to 29%, while saturated fat reaches 26% and added sugar accounts for 19%.
Dinner exhibits the most concerning nutritional profile, with sodium peaking at 43%, saturated fat at 37%, and added sugar at 23%. The progression from breakfast through dinner reveals a consistent upward trend for all three nutrients, suggesting that evening meals contribute disproportionately to daily intake of these potentially harmful substances.
Model Answer 2
The three pie charts provide a comprehensive breakdown of nutritional composition across typical daily meals, specifically examining the percentage distribution of sodium, saturated fat, and added sugar – three nutrients that pose health risks when consumed excessively.
A striking pattern emerges from the data: all three nutrients demonstrate progressive accumulation throughout the day, with dinner consistently exhibiting the highest concentrations and breakfast maintaining the most moderate levels. This nutritional trajectory suggests significant dietary implications for meal planning and health management strategies.
Breakfast presents the most balanced nutritional profile among the three meals, with sodium and added sugar each comprising 14% and 16% respectively, while saturated fat accounts for 16% of the meal composition. This relatively equitable distribution contrasts sharply with the subsequent meals’ increasingly concentrated nutrient densities.
The food pie chart percentages reveal substantial escalation in lunch consumption, where sodium surges to 29%, representing more than double the breakfast level. Saturated fat increases to 26%, while added sugar rises moderately to 19%. Dinner demonstrates the most pronounced nutritional concentration, with sodium reaching a peak of 43% – representing nearly triple the breakfast amount. Saturated fat climbs to 37%, and added sugar attains its highest level at 23%, creating a cumulative effect that positions dinner as the primary contributor to daily intake of these potentially detrimental nutrients.
Step-by-Step Breakdown of the Sample Answer
- Introduction: Begin your food pie chart percentages report by paraphrasing the task description while avoiding direct copying from the original prompt. Transform the given information about “average percentages in typical meals” into more sophisticated language such as “comprehensive breakdown of nutritional composition across daily meals.” This approach demonstrates your linguistic flexibility while accurately representing the data scope and purpose.
- Overview: Identify the most significant overall trends before examining specific details. Highlight the progressive increase in nutrient concentrations from breakfast through dinner, emphasizing that this pattern applies consistently across all three nutrients. This section should provide readers with a clear understanding of the primary findings that will guide your detailed analysis.
- Body Paragraph 1: Focus on breakfast and lunch data, presenting specific percentages while explaining the nutritional progression between these meals. Additionally, use comparative language in food pie chart percentages report to establish relationships between nutrient levels and demonstrate how lunch represents an intermediate stage in the daily nutritional accumulation pattern.
- Body Paragraph 2: Analyze dinner data while connecting it to the established pattern from earlier meals. Emphasize the dramatic increases in all nutrient categories and explain the implications of these concentrations for overall dietary health considerations throughout the day.
To further strengthen your IELTS Task 1 writing skills, it’s essential to study how similar pie chart questions are approached in different contexts. For example, the Pie Chart of Water Usage in India demonstrates how descriptive techniques apply to geographical data and resource distribution. For a complete understanding of strategies and structures that consistently score highly, the Task 1 Pie Chart guide offers a comprehensive breakdown of vocabulary, structure, and analysis approaches across all pie chart types.
Useful Vocabulary for Food Pie Chart Percentages Task 1
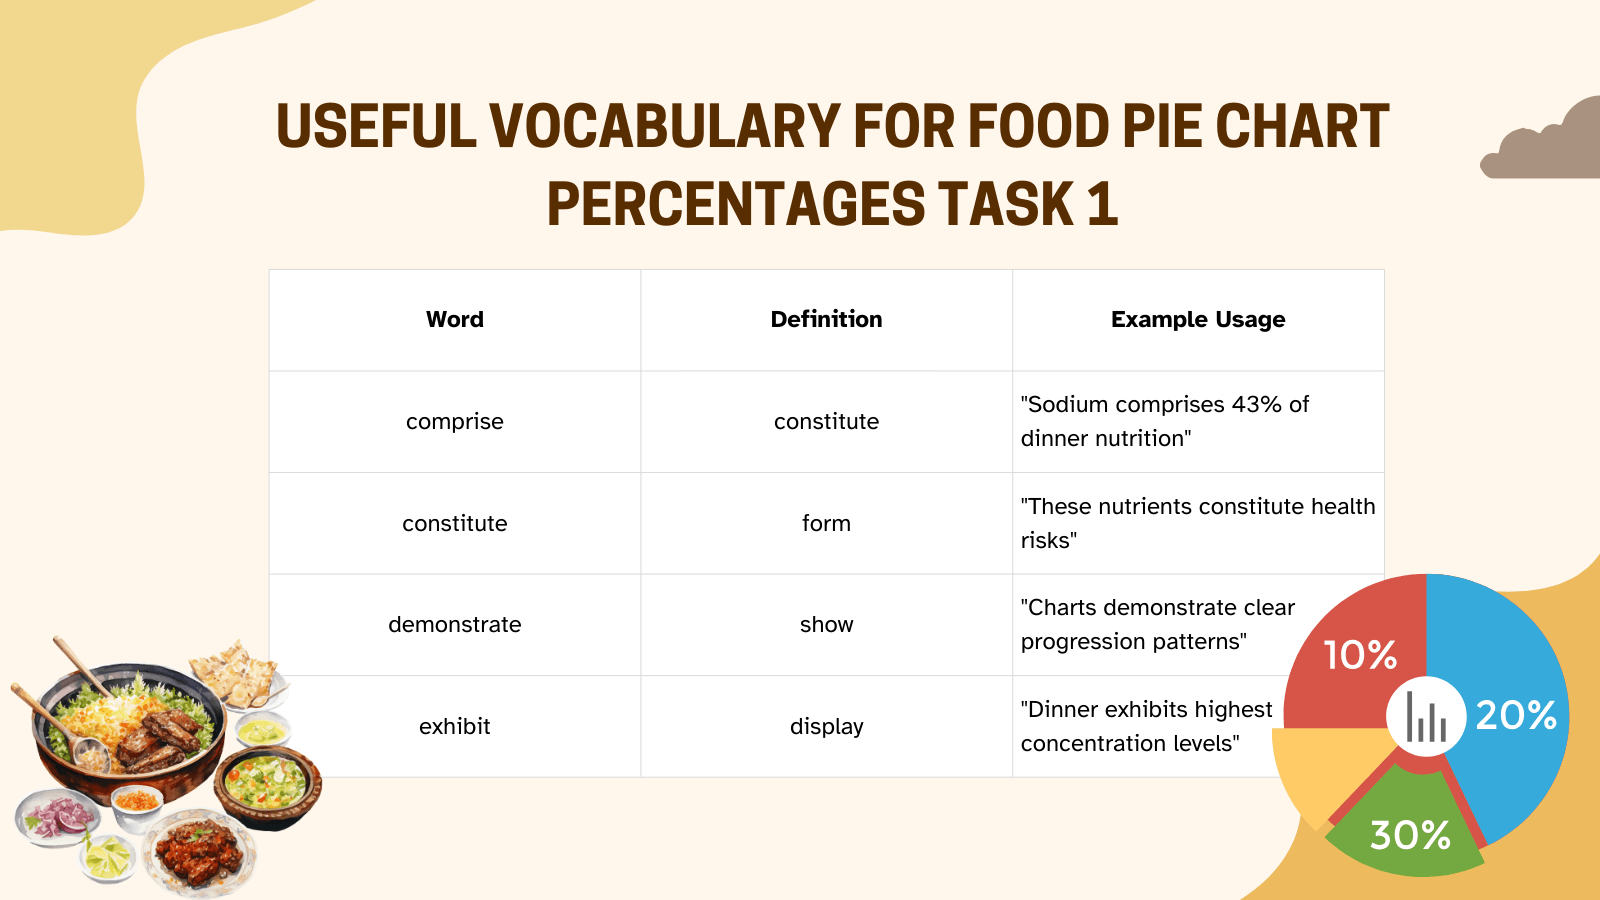
| Word | Definition | Example Usage |
| comprise | constitute | “Sodium comprises 43% of dinner nutrition” |
| constitute | form | “These nutrients constitute health risks” |
| demonstrate | show | “Charts demonstrate clear progression patterns” |
| exhibit | display | “Dinner exhibits highest concentration levels” |
| surge | increase | “Sodium levels surge dramatically at dinner” |
| escalate | rise | “Nutrient content escalates throughout day” |
| accumulate | build | “Harmful substances accumulate progressively” |
| predominate | dominate | “Sodium predominates in evening meals” |
| substantial | significant | “Lunch shows substantial nutrient increases” |
| pronounced | marked | “Dinner reveals pronounced concentration peaks” |
| moderate | balanced | “Breakfast maintains moderate nutrient levels” |
| equitable | fair | “Morning meals show equitable distribution” |
| trajectory | pattern | “Nutritional trajectory rises consistently” |
| culminate | peak | “Daily intake culminates at dinner” |
| whereas | while | “Breakfast remains low whereas dinner peaks” |
| conversely | opposite | “Conversely, dinner shows maximum concentrations” |
| consequently | therefore | “Consequently, evening meals pose health risks” |
| notably | remarkably | “Notably, all nutrients follow similar patterns” |
| substantially | considerably | “Dinner levels increase substantially” |
| progressively | gradually | “Nutrients accumulate progressively daily” |
Conclusion
Successfully analyzing food pie chart percentages requires developing strong data interpretation skills alongside sophisticated academic writing techniques. Your ability to identify patterns, make meaningful comparisons, and present findings using precise vocabulary determines your Task 1 performance level.
Focus on building comprehensive analytical frameworks that allow you to examine nutritional data systematically while maintaining clear communication throughout your response. Practice regularly with various food-related charts to strengthen your confidence in handling percentage-based visual information and developing the linguistic precision necessary for high band scores in IELTS Writing Task 1.