

IELTS Writing Task 1 pie chart questions challenge countless test-takers worldwide, yet mastering this visual data analysis can significantly boost your overall Writing band score. IELTS Sample Bank comprehensive guide transforms complex pie chart interpretation into manageable, systematic techniques that work consistently across all chart types.
Whether you’re facing static single charts or dynamic multi-period comparisons, you’ll discover proven structural frameworks, essential vocabulary, and analytical strategies that examiners recognize as hallmarks of high-scoring responses, empowering you to approach any task 1 pie chart with complete confidence.
What is a Task 1 Pie Chart Report?
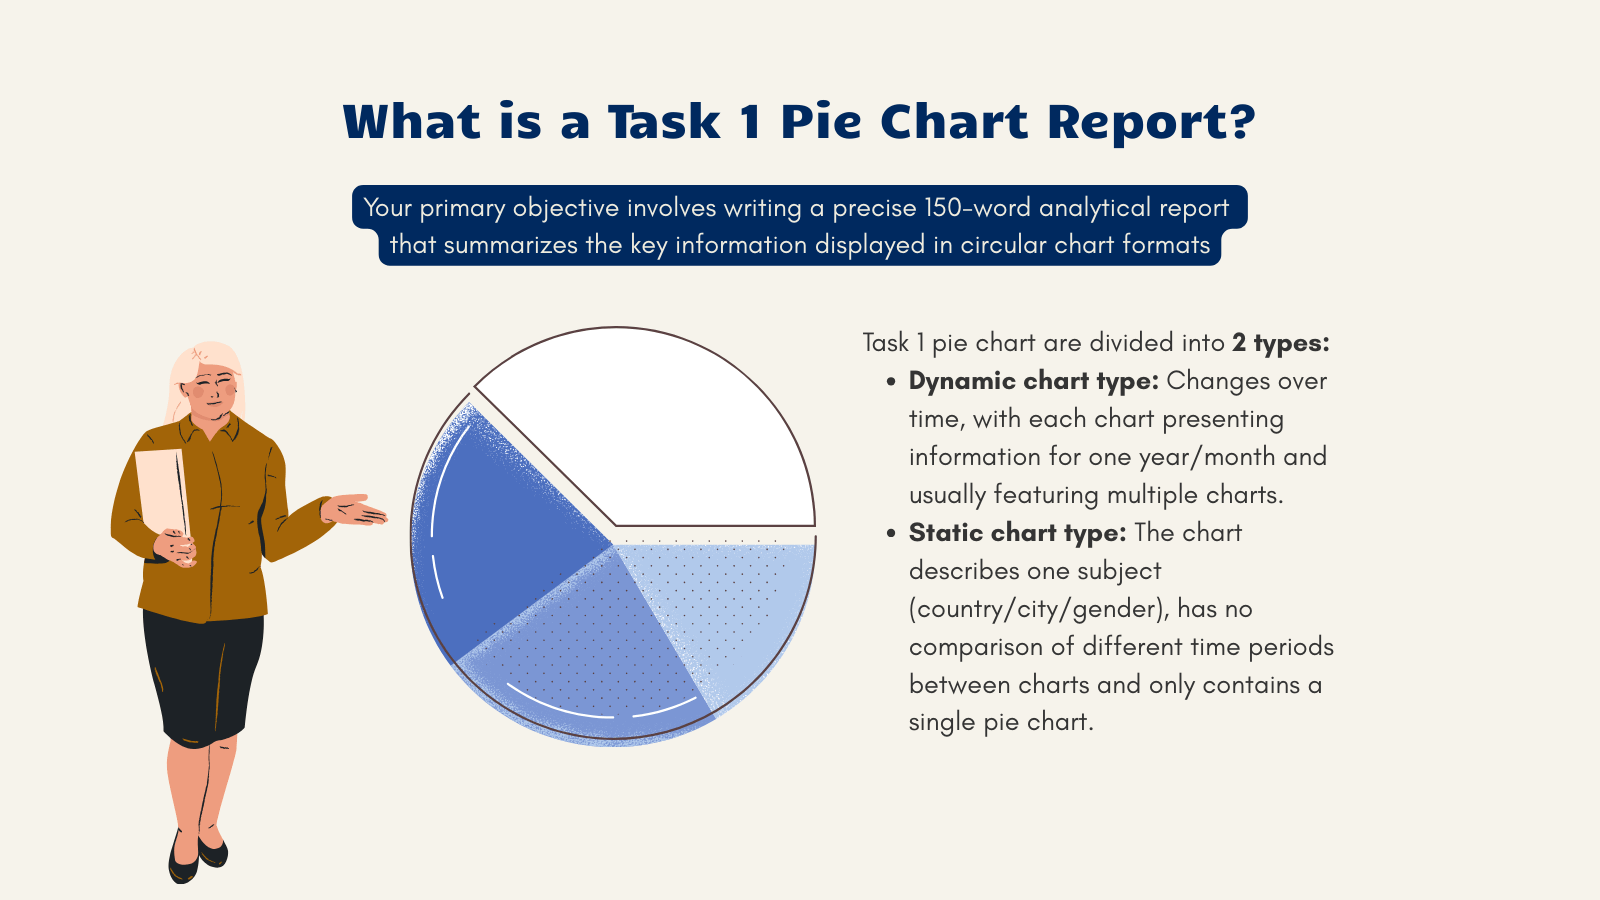
A task 1 pie chart report represents one of the most common visual data presentations you will encounter in the IELTS Academic Writing test. Your primary objective involves writing a precise 150-word analytical report that summarizes the key information displayed in circular chart formats, describing main features and making relevant comparisons without expressing personal opinions or interpretations.
The fundamental requirement centers on transforming visual data into coherent written analysis within exactly 20 minutes. You must demonstrate your ability to identify significant patterns, compare different segments, and present findings using appropriate academic language. This task type specifically tests your capacity to interpret statistical information and communicate findings clearly to an academic audience.
Task 1 pie chart are divided into 2 types:
- Dynamic chart type: Changes over time, with each chart presenting information for one year/month and usually featuring multiple charts.
- Static chart type: The chart describes one subject (country/city/gender), has no comparison of different time periods between charts and only contains a single pie chart.
Apart from task 1 pie chart, you’ll also encounter a range of other chart types in IELTS Writing Task 1:
How to Write Task 1 Pie Chart: 5 Essential Steps

Step 1: Analyze the Chart (2 minutes)
- Begin your task 1 pie chart approach by conducting systematic visual analysis that identifies all essential elements requiring description.
- Examine the chart title carefully to understand the specific context, time period, and measurement units being presented.
- Note whether percentages, raw numbers, or other units quantify the data segments. Identify the largest and smallest categories immediately, as these represent the most significant features requiring emphasis in your overview.
- Look for any surprising or unexpected data patterns that distinguish this particular chart from typical distributions in similar contexts.
Step 2: Plan Your Structure (1 minute)
Create a mental framework organizing your four paragraphs before beginning to write your response. Allocate specific content to each section in task 1 pie chart: introduction paraphrasing, overview highlighting, first body paragraph covering major segments, and second body paragraph addressing remaining categories.
Step 3: Write the Report (15 minutes)
- Follow your predetermined structure without deviation, focusing on clear communication rather than complex language experimentation.
- Maintain consistent paragraph lengths and logical information flow throughout your response.
- Write your introduction by rephrasing the prompt, develop your overview with broad trend identification, then proceed systematically through your body paragraphs with supporting statistical evidence.
Step 4: Use Precise Language
Incorporate specific vocabulary designed for data description and statistical reporting. Your word choices should demonstrate academic register appropriateness while maintaining clarity and precision. This linguistic accuracy significantly impacts your Lexical Resource scoring and overall band achievement.
Step 5: Review and Edit (2 minutes)
Conduct focused proofreading examining grammar accuracy, spelling correctness, and word count compliance. Check that your response addresses all task requirements and maintains consistent verb tenses throughout. Verify that your overview accurately reflects the detailed information presented in body paragraphs.
To reinforce these strategies and see how they’re applied in real IELTS Task 1 pie chart responses, explore the following sample essays. Each demonstrates clear organization, effective vocabulary, and strong data analysis — exactly the skills you need for a Band 8+ answer:
-
Balanced Diet Pie Chart with Percentages – shows how to structure your response around nutritional distribution data.
-
Food Consumption Pie Chart Percentages – illustrates how to group and compare categories effectively in a food-related context.
-
Pie Chart of Water Usage in India – an excellent example of presenting data distribution with clear comparisons and overview statements.
Key Vocabulary for IELTS Writing Task 1 Pie Chart
Developing comprehensive vocabulary for statistical reporting enhances your ability to describe pie chart ielts task 1 data with precision and variety. The following linguistic resources provide essential tools for creating sophisticated, academically appropriate responses that demonstrate advanced English proficiency.
1. Verbs for Reporting Statistical Data:
| Function | Vocabulary Options |
| Basic reporting |
|
| Proportion indication |
|
| Dominance expression |
|
| Comparison making |
|
2. Expressing Proportions with Precision:
| Percentage Range | Fraction Equivalent | Phrasal Description |
| 51-60% | just over half | a narrow majority |
| 75-80% | three-quarters | a substantial majority |
| 90%+ | nearly all | the vast majority |
| 25% | one-quarter | a quarter of the total |
3. Language for Data Description and Comparison:
| Category | Function | Vocabulary Options |
| Approximation Language | Expressing imprecise figures |
|
| Contrast Expressions | Showing differences |
|
| Similarity Expressions | Showing similarities |
|
| Pattern Description | Establishing relationships |
|
| Transition Phrases | Connecting comparisons |
|
Task 1 Pie Chart Model Answer
Two pie charts comparing household expenditure patterns between 1950 and 2010, showing six categories: Housing, Food, Health care, Education, Transportation, and Other

Task 1 pie chart sample answer:
The pie charts compare household expenditure patterns across six categories between 1950 and 2010. Overall, there was a dramatic shift in spending priorities over this 60-year period, with housing costs declining substantially while food expenses and the “other” category increased significantly.
In 1950, housing dominated household budgets, accounting for nearly three-quarters of total expenditure at 72.1%. Food represented just over one-tenth of spending at 11.2%, while education comprised 6.6% of household expenses. The remaining categories occupied relatively minor portions: other expenses at 4.4%, transportation at 3.3%, and health care at merely 2.4%.
By 2010, spending patterns had transformed dramatically. Food became the largest expense category at 34.0%, while housing dropped to just 22.0% of total expenditure. Other expenses increased substantially to 19.2%, and transportation costs rose significantly to 14.0%. Health care spending nearly doubled to 4.5%, whereas education remained relatively stable at 6.3%, showing minimal change over the six-decade period.
Key analytical techniques that elevate this task 1 pie chart response:
- Strategic data grouping for Task Achievement: The writer identifies housing (72.1% to 22.0%) and food (11.2% to 34.0%) as the primary story, immediately establishing the most significant pattern examiners expect to see highlighted
- Lexical Resource demonstration: The progression from basic reporting (“accounted for”) to sophisticated alternatives (“dominated,” “comprised,” “transformed dramatically”) shows vocabulary range that targets Band 7+ scoring
- Coherence through chronological structure: Each body paragraph represents one time period, preventing confusion and enabling clear before-after comparison that supports the overview’s claims about dramatic change
- Grammatical Range application: Complex sentence structures like “By 2010, spending patterns had transformed dramatically” combine past perfect and simple past tenses appropriately for time-based comparison
- Precise numerical integration: Specific percentages support general claims (e.g., “dominated” backed by “72.1%”), satisfying Task Achievement requirements for detailed support
VI. Conclusion
Before submitting your writing task 1 pie chart response, verify your introduction paraphrases the prompt effectively. Confirm your overview identifies key features without specific data. Check that body paragraphs provide complete statistical coverage with appropriate comparative language. Ensure consistent tense usage, accurate grammar, objective tone, and 150-180 word count. Double-checking all numerical data accurately reflects the chart information.