
Picture yourself staring at a bewildering maze of arrows, boxes, and technical diagrams—your IELTS Process Chart Task 1 nemesis glaring back from the page. What separates struggling test-takers from Band 9 champions isn’t luck or natural talent, but mastering a strategic blueprint that transforms chaos into clarity. In this article, ieltssamplebanks.com will help you unveil the secret architecture behind high-scoring responses, equipping you with battle-tested techniques to decode any process diagram with surgical precision and craft compelling narratives that captivate examiners and secure your target score.
4-Step Plan for Process Chart Task 1 Quick Explanation
When faced with a process chart in IELTS Writing Task 1, many candidates feel unsure where to begin. Unlike graphs or tables, you’re not comparing numbers — you’re describing how something moves, forms, or transforms over time.
Whether it’s a manufacturing phase, a biological cycle, or a technical system, your task is to narrate the process like a clear, step-by-step story — using precise grammar, logical transitions, and formal academic tone. Here’s a four-phase method to help structure your response with confidence.
- Step 1: Analyze & Group – Identify the process type and divide stages logically
- Step 2: Paraphrase Introduction – Rewrite the prompt using varied vocabulary
- Step 3: Write Overview – State total stages, starting point, and final outcome
- Step 4: Detail Stages – Describe each step using appropriate grammar and sequencing language
The strategy outlined here addresses the specific requirements examiners seek when evaluating task 1 diagram responses. Each step builds upon the previous one, creating a framework that works regardless of whether you encounter manufacturing processes, natural cycles, or technical procedures. This approach ensures your response demonstrates the four key assessment criteria of process chart task 1: task achievement, coherence and coherence, lexical resource, and grammatical range and accuracy.
2 Main Types of Process Chart Task 1
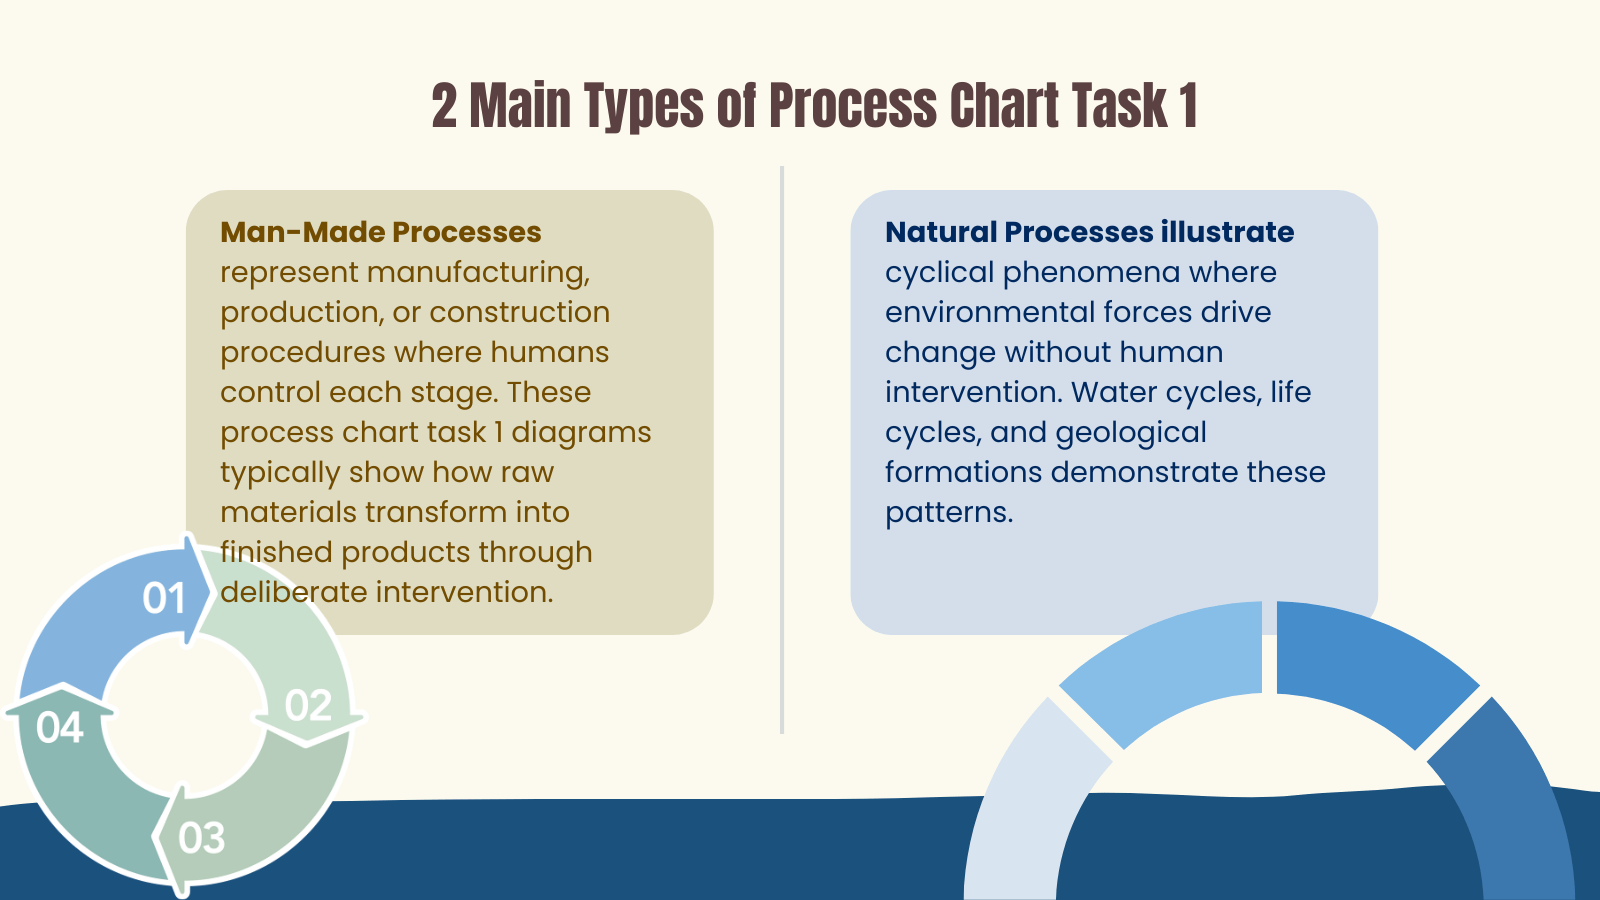
- Man-Made Processes represent manufacturing, production, or construction procedures where humans control each stage. These process chart task 1 diagrams typically show how raw materials transform into finished products through deliberate intervention.
Coffee production, chocolate manufacturing, and brick-making exemplify this category. The defining characteristic involves human agency directing each transformation step. You can explore examples such as the Manufacturing of Brick Diagram or the Sugar Manufacturing Process to see real IELTS visuals of this category.
- Natural Processes illustrate cyclical phenomena where environmental forces drive change without human intervention. Water cycles, life cycles, and geological formations demonstrate these patterns.
Natural process chart task 1 often returns to their starting point, creating continuous loops rather than linear progressions. Weather patterns, plant growth cycles, and erosion processes fall into this classification.
The distinction matters because grammar choice depends entirely on process type. Man-made diagram ielts task 1 requires passive voice construction since objects undergo actions performed by people or machines. Natural processes demand active voice because natural forces act as subjects performing actions.
IELTS Process Chart Essay: A Clear, Paragraph-by-Paragraph Breakdown
Understanding how to structure your process chart Task 1 response is often what separates a Band 6 from a Band 7+. Below is a breakdown of what each paragraph should do — and how to get it right.
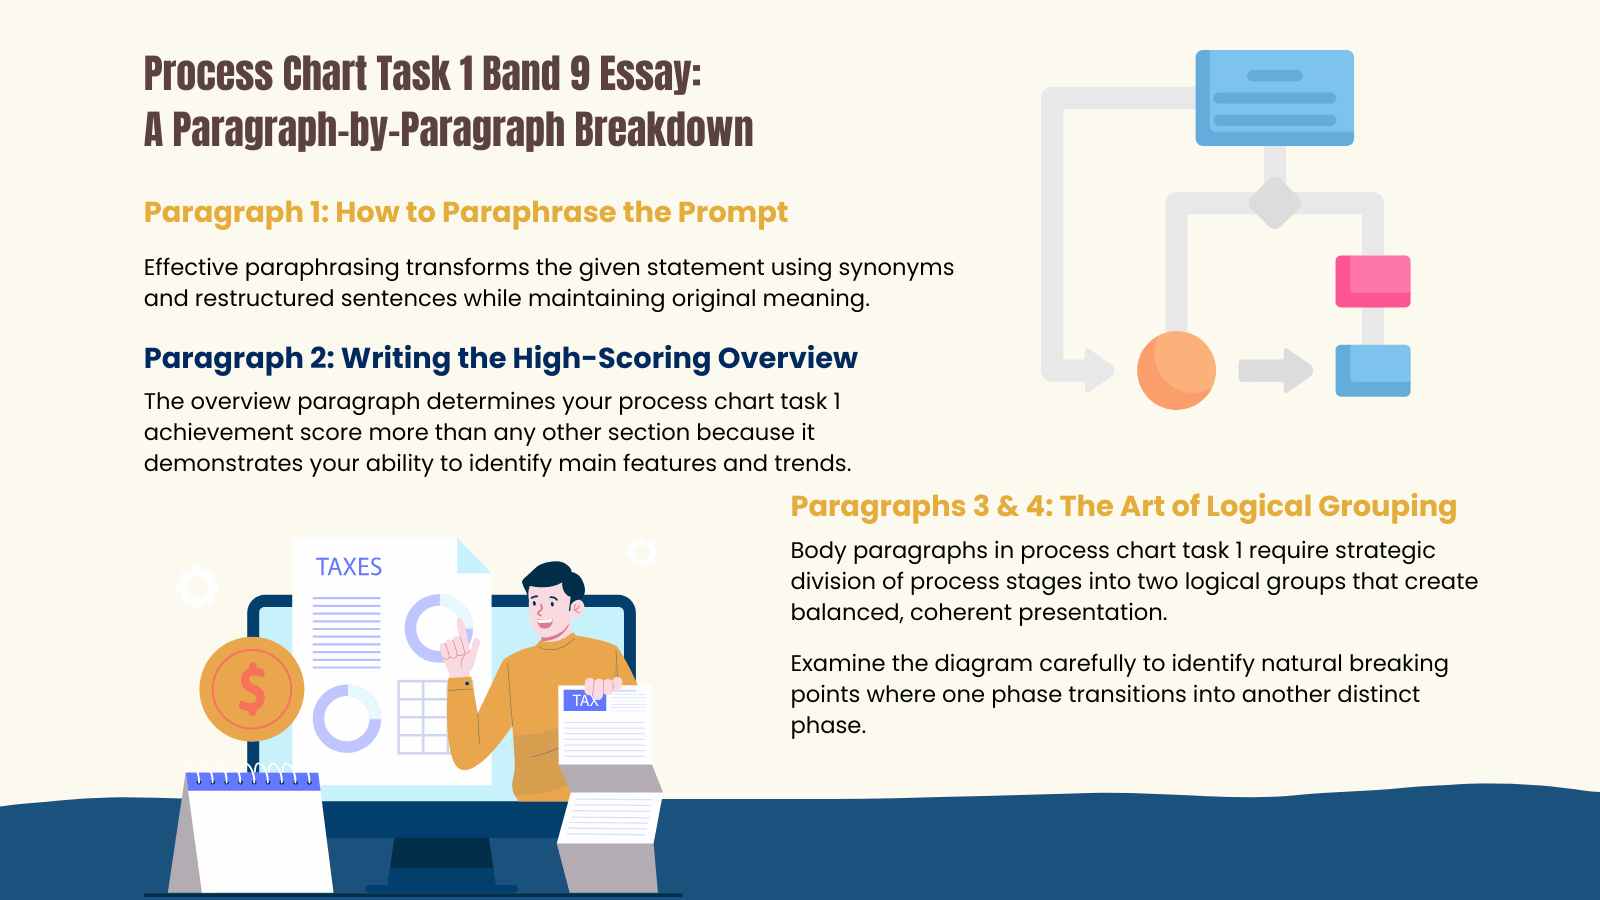
Paragraph 1: How to Paraphrase the Prompt
Effective paraphrasing transforms the given statement using synonyms and restructured sentences while maintaining original meaning. Replace “shows” with alternatives like “illustrates,” “depicts,” “outlines,” or “demonstrates” to avoid repetition. Similarly, substitute “process” with “procedure,” “method,” or “stages involved in” to display vocabulary range.
The paraphrasing formula combines these elements:
[The diagram] + [action verb] + [process description] + [additional detail].
For example, if the prompt states “The diagram shows the process of making chocolate,” your paraphrase might read “The illustration depicts the procedure involved in chocolate production.” This approach satisfies task achievement requirements while demonstrating lexical flexibility.
Paragraph 2: Writing the High-Scoring Overview
The overview paragraph determines your process chart task 1 achievement score more than any other section because it demonstrates your ability to identify main features and trends. Examiners specifically look for candidates who can synthesize information rather than simply describe individual steps. Your overview must include three essential elements that work together to create comprehensive understanding.
First, state the total number of stages clearly and precisely. Count carefully because accuracy matters for credibility. Second, identify the starting point or initial input that begins the entire process. Third, mention the end result or final output that concludes the sequence. This three-point formula ensures complete coverage while maintaining concise presentation that examiners value highly.
Paragraphs 3 & 4: The Art of Logical Grouping
Body paragraphs in process chart task 1 require strategic division of process stages into two logical groups that create balanced, coherent presentation. Examine the diagram carefully to identify natural breaking points where one phase transitions into another distinct phase. Manufacturing processes often divide between preparation stages and production stages, while natural cycles might separate between growth phases and decay phases.
Successful grouping depends on understanding relationships between consecutive steps rather than simply counting stages. Look for shifts in location, changes in materials, or transitions between different types of actions.
For instance, chocolate production might group initial processing (harvesting, fermentation, drying) in paragraph three and manufacturing processes (roasting, grinding, tempering) in paragraph four. This logical organization demonstrates coherence and helps readers follow complex sequences easily.
Essential Grammar and Vocabulary for a High Score
Passive vs. Active Voice
Passive voice construction dominates process chart task 1 writing because diagrams typically focus on what happens to objects rather than who performs actions. The passive formula follows this pattern:
[Object] + [to be verb] + [past participle] + [by agent (optional)].
This structure shifts emphasis from the actor to the action’s recipient, which aligns perfectly with diagram presentation.
Consider these transformations:
- “Workers harvest the beans” becomes “The beans are harvested.”
- “Machines grind the cocoa” transforms into “The cocoa is ground by machines.”
The passive voice maintains focus on materials undergoing change while de-emphasizing human involvement. However, natural processes occasionally require active voice when natural forces act as clear subjects: “The sun evaporates the water” or “Gravity pulls the sediment downward.”
Active voice appears appropriate in process chart task 1 when natural elements perform obvious actions in cyclical processes. Wind moves clouds, heat melts ice, and pressure compresses materials. These instances require active construction because natural forces function as genuine subjects performing identifiable actions.
Understanding this distinction will help in other visual tasks as well, like the Two Maps Below Show an Island, where transformation verbs also shift between active and passive based on focus.
Important Vocabulary for IELTS Process Chart Task 1
Sequencing language creates smooth transitions between process stages while demonstrating sophisticated vocabulary control.
| Function | Phrase | Meaning |
| Starting | Initially | At the beginning of the process |
| First | Before any other step | |
| To begin with | As the opening stage | |
| At the outset | From the very start | |
| Continuing | Subsequently | Happening after the previous step |
| Following this | Coming directly after | |
| Then | Next in sequence | |
| After that | Following the mentioned stage | |
| Thereafter | From that point onward | |
| Showing Result | Consequently | As a direct result |
| This results in | This causes or produces | |
| Leading to | Causing something to happen | |
| Thereby producing | Through this action, creating | |
| Which causes | That makes something happen | |
| Concluding | Finally | At the end of all stages |
| Ultimately | As the final outcome | |
| In the final stage | During the last step | |
| Eventually | After all processes complete | |
| Simultaneous | Meanwhile | At the same time |
| Simultaneously | Happening together | |
| Concurrently | Occurring at once |
An Annotated Band 9 Sample Answer
Process chart task 1 sample question: The diagram below shows how coffee is produced and prepared for sale in supermarkets and shops.

The diagram illustrates the procedure involved in coffee production, from initial harvesting through to the final preparation of instant coffee for retail distribution. Overall, the process comprises eleven distinct stages, beginning with bean collection and culminating in packaged instant coffee ready for consumer purchase.
Initially, ripe coffee beans are picked by hand from coffee plants and subsequently spread out under direct sunlight for drying purposes. Following this drying phase, the dried beans are roasted using specialized equipment that transforms their color and develops characteristic flavors. After roasting, the beans are cooled rapidly to halt the cooking process and preserve optimal taste qualities.
The cooled beans are then ground into fine particles using industrial grinding machinery, after which they are mixed with hot water to create a concentrated coffee extract. This mixture is subsequently strained to separate liquid from solid particles, producing a pure coffee solution. The filtered liquid undergoes a freezing process that solidifies the extract, which is then ground again into granular form.
In the final manufacturing stage, the granulated coffee undergoes vacuum drying, which removes remaining moisture while preserving flavor compounds. Finally, the dried instant coffee granules are packed into sealed jars with appropriate labeling before distribution to supermarkets and retail outlets.
For more detailed manufacturing visuals, check out the Sugar Manufacturing Process and the Geothermal Energy Diagram, both of which appear frequently in IELTS exams.
Conclusion
Achieving excellence in process chart task 1 transforms from overwhelming challenge to systematic success through the four-step framework presented here. This approach – analyze and group, paraphrase introduction, write overview, detail stages – works consistently across all diagram types while building confidence through repeated application.
Success emerges through deliberate practice rather than memorization. Each new diagram becomes an opportunity to refine these core principles, developing the grammatical precision and vocabulary sophistication that distinguish Band 9 responses. Your investment in these skills extends far beyond test day, creating communication abilities that enhance academic and professional achievements throughout your career.
Continue building your IELTS Task 1 mastery through connected lessons such as the IELTS Mix Chart, Task 1 Map, and Task 1 Pie Chart, which collectively develop the synthesis and description skills needed for Band 9 writing.